Rescue Me From Blight (Seriously)
It’s 1947. You have neither TV nor blogs — how do you evangelize? Posters and pamphlets of course.
Eric Fisher brings us scans from the 1947 campaign to redevelop the Western Addition, aka “raze a neighborhood.”
One method is the strategic use of color. Simply layer green upon black. Problem solved!

Down with fire! And garbage! And bay windows! And cars running into giant oil barrels!

Imagine what these guys could have done with Photoshop
Note: I’m all for public health and children not living in squalor. But the shame of children wearing overalls and the high social cost of dressing like hipsters clearly justify massive urban renewal.

Mr. Stripey Jacket kind of looks like Morrissey, either with a hangover, or about to start a solo.
I did find this copy entertaining:
“Gone are the disreputable joints, the so-called smoke shops, the ‘hotels,’ and pool hall hangouts known to the police. Gone, too, are the alleys in which juvenile gangs plotted mischief that sometimes ended in murder.”
Damn you, 1940s — we could use a couple more pool halls in the Mission. That pool table at Latin American is rarely free of jackets or asses (not that I could get through a game with their margs.) But I digress.
“The rigid street system, with its death-trap intersections, is reorganized, simplified. The indiscriminate mixture of commercial, industrial and residential structures that is the disease of blighted areas is nowhere to be seen.”
Guess they were against mixed-use development. Given that’s a primary reason I live in SF (so I can walk places) I don’t think I would have enjoyed the New City. Sure looks pretty though:

"Honey, here blight was once rife."
While the 40s-era planners’ “build projects and highways” plans may have been flawed, were they onto something in terms of urban renewal, quality of life and safety? Did they see the fundamental changes in society and the jump in crime that would be brought by the 60s?
I found some ridiculously detailed homicide stats that name every person ever murdered in SF from 1849 to 2003 — the very first on the list was Beatty Belden, shot by “Chileans” on Telegraph Hill because of a “misunderstanding” — and crunched some numbers over time. (I took the 10 year census numbers and extrapolated SF population for other years , except for the last 10 years where I found yearly US census estimates.)
")
SF Homicide Rate, 1860-2008 (per 100K)
The 20s-40s were positively halcyon days in terms of murder in San Francisco — I’m kind of surprised that the rate was so low during the Great Depression and Prohibition.
But murder rates jumped drastically in the 60s. I’m neither a statistician nor a criminolisiticist, so sorry for any miscalculations, but homicide rates approached those of the 1870s.
This jump happened nationally, pointing to greater societal issues, but the SF rate was surprisingly high, even compared to NYC during the 70s. Granted cities like DC/Detroit/Baltimore were much higher, but let’s face it, the 60s-80s (suburban flight, racial discord) was a rough time for America.

SF-NY-Chi-US Homicide Rate, 1870-2007
US and FBI data, NY source data, Chicago data. Lots of extrapolating but the trends are clear.
SF leveled off in the 70s, and the 90s were a turning point for the rest of the nation. Chicago is well on its way down and NYC homicides have plummeted and now at the national average. SF was dropping as well but is now ticking up, WTF?
But I guess Gavin can rest comfortably knowing that none of this matched the epic murder rates of the Barbary Coast days of the 1850s (or New Orleans today).
")
SF Homicide Rate, 1849-2008 (per 100K)
For all those sociologists out the frantically pounding away in the comments section that I’m doing it wrong, you’re probably right. In fact, the FBI puts out a press release each year warning people not to do a straight comparison of homicide rates. Georgia State University publishes a homicide ranking list adjusting for socioeconomic factors (poverty, median income, male unemployment, race composition, and female-headed families). SF doesn’t come out so well.
| City | Adjusted Rank | Net Rank |
| Newark | 1 | 4 |
| Baltimore | 2 | 2 |
| St Louis | 3 | 3 |
| Oakland | 4 | 6 |
| Phoenix | 5 | 22 |
| San Francisco | 6 | 23 |
| Albuquerque | 7 | 38 |
| DC | 8 | 5 |
| Miami | 9 | 11 |
| Tulsa | 10 | 19 |
| LA | 21 | 32 |
| Chicago | 50 | 17 |
| New York | 60 | 47 |
Once again I find myself at the end of a post much longer than I intended to write, struggling to come to some sort of meaningful summary on top of snarky commentary and pretty pictures. (Damn you Eric Fisher!)
As for the idea of grassy fields and apartment buildings calming society, I doubt it would have made a difference in the 60s. Just look at the failure of most if not all American housing projects or the riots in the banlieues of Paris in 2005. You can build all the elevators you want but race and jobs are undeniable factors.
Despite the crime wave in the 70s, New York made such density via elevation work. But how many other any other cities have done so? Tokyo? Vancouver? Singapore? Not many. What makes the difference? Is it possible to build a society that matches density with safety, or are we at the mercy of national socioeconomic trends?
Frog Peril
Poor Mr. Frog — he never saw it coming:

Oh, and by the way, orca always wins. I don’t care what those Swedes think.

Noe Valley – Bringing You Blight Since 1945
Oh, Noe, you looked down upon the Mission and thought you were blight free. But 1945 disagrees:
“San Francisco is an old city. Much of it is built of wood. The areas of obvious blight and decay are generally those spared by the 1906 fire. Here buildings 40, 50, and 60 years old are crowded together. They have been patched, repaired, and changed into apartments, stores, rooming houses, and garages. The districts in which these conditions are found are convenient to the business and industrial centers. Streets, schools, and utilities are all in. The land is gently sloping, the climate excellent. But the future of this once valuable property will be dark until the old structures can be scrapped and attractive new buildings adapted to modern needs can be built on the land.”
Eric brings us the blighted Noe Valley in 1945:
“Blight disfigures San Francisco, drives people out of the city, interferes with business and industrial development, lowers the value of good property, increases the costs of government. An attractive, new city can be built by reclaiming blighted areas.”
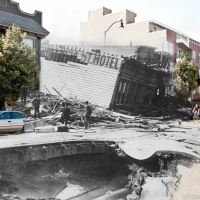
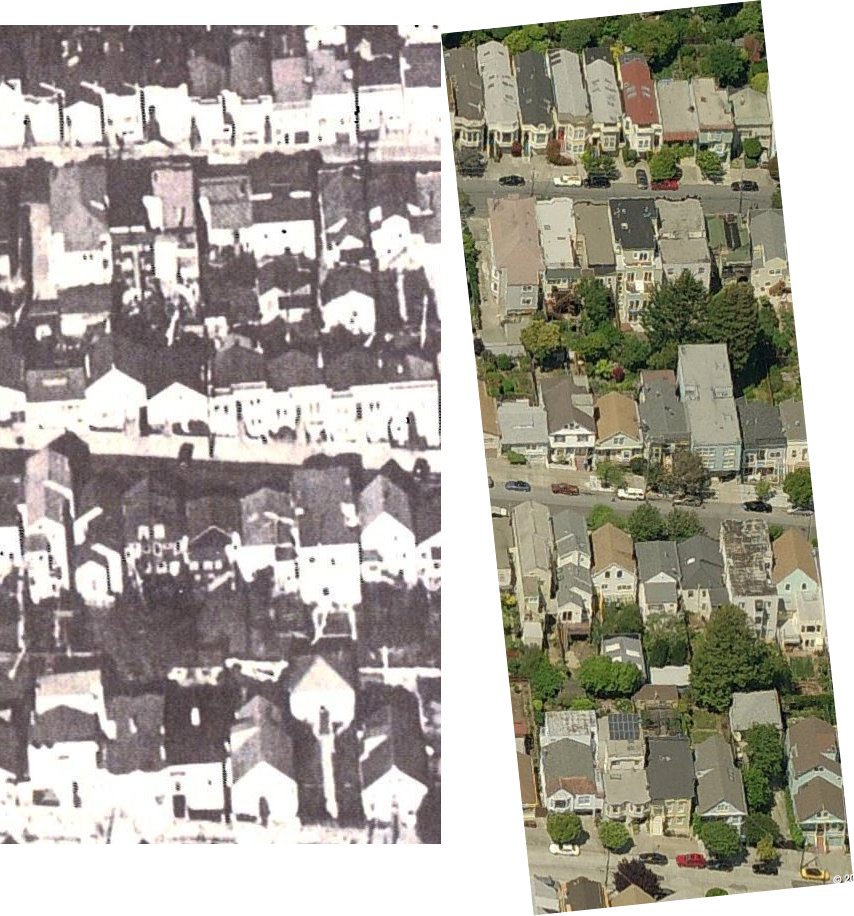
This is 1945, looking north on Sanchez, with Duncan on the bottom and 25th on the top:

Link to today via Microsoft’s birdseye view, but for easy comparison let us zoom in and see the utopian vision brought on by the sweeping aside of blight and decay, with so many chang… err, wait… I think only one building turned over.

Oh, lazy post-war San Franciscans. You missed your chance to reubuild a glorious and shiny future! History clearly will curse you for ignoring those fateful words of the wise 1945 planners — this once valuable property will be dark until the old structures can be scrapped and attractive new buildings adapted to modern needs.
Poor, poverty-stricken Noe Valley, worth nothing.

Makes you wonder what Fillmore and the Western Addition would have been like had the city not so generously redeveloped it.
The Mission – Bringing You Blight Since 1945
Scanner, history. History, scanner.
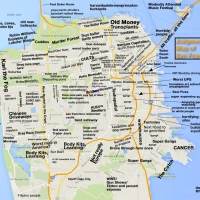
Here we have “The Master Plan of the City and County of San Francisco: Classification of Areas for Redevelopment (1945)” scanned by the indominable Eric Fischer.
While less colorful than our previous Blight Map of 1948, this is more detailed, revealing blight block by block. (Guess if the dark shading means good or bad.) Behold a 450 pixel-wide slice of blight from North Beach down to the Mission.

(Note this is even before 101 went in. And they certainly had their eyes on building on top of Bernal — those would have been epic streets.)
Here we have the key:

$40 adjusted for inflation is just under $500 today — I can only imagine how gobsmacked the city planners of 1945 would be to see Craigslist rental prices 3 to 6 times higher on their “substandard” properties.
It’s fascinating how blocks with million dollar homes were considered tear-downs 65 years ago.
BART vs Freeway Retro-Futurism
Once again Eric Fischer makes blogging easy.
While this 1957 BART plan is impressive…

…or this detail of the proposed Geary Line…

…freeway drawings are so much sexier and distracting for long-term transit planning.
1964 plan for the crosstown freeway, Union & Lyon:

My, what a glorious and elegant Civic Center freeway exchange — life will to have been good!

xkcd Star Wars Character Proximity Map
xkcd – droll nerd webcomic – has published what will invariably become a classic, a diagram of movie characters’ proximity vs time. Crop of the Star Wars timeline:

Hey, this looks like a subway map! (Especially given R2, 3P0 and Chewie are color-coded.)
Full version also includes other lesser movies such as Lord of the Rings and Jurrasic Park:

I am ridiculously jealous I didn’t think of this first. Someone needs to do this for Gavin Newsom and the Board of Sups. (And Allan!)
Note for Mission dwellers — there is an xkcd Spanish translation. (And Russian. Превед, медведь!)
I seriously worry about the order in which my daughter will watch the Star Wars movies. Damn well is going to be IV/V/VI if I have anything to do with it. But what if she watches I/II/III at a sleepover?!? Nooooooo!
Muuuch later I will teach her the Star Wars drinking game. The Force is obviously a social. Other rules (that I remember):
- Something doesn’t work on the Millennium Falcon.
- Sexual tension between Han and Leia.
- A planet is described as having a single environment.
- Stormtrooper armor fails.
- Luke whines about something (whoever gets this one is seriously screwed).
Golden Gate DAAAAMN….
Telsar Logistics brings us some more awesome.

Click for a bevy of bridge climbing photos in the Flickrstream.
Best bridge ever? Quite possibly. (I have a sneaking suspicion that Herb Caen was wrong. Wind my ass — it was Sutro Tower that lashed out at the Bay Bridge. )
Dear Golden Gate Bridge,
Thank you for always being there for me. Thank you for being so gorgeous and so famous and so convenient for me. Thank you for never collapsing into the Bay or succumbing to terrorism. Thank you for your cables and your color. Thank you for not only being so much more attractive than your counterparts, but so much more reliable. You’re like the opposite of people, what with your good looks and yet, great personality.
Thank you for never letting suicides get you down. Thank you for tolerating tourists who videotape you while hanging out the windows of their rental cars. Thank you for keeping your shit together when everyone else is losing theirs.Thank you, Golden Gate Bridge, for being there for me throughout my entire life, for never letting me down, for getting me to school and to work every day. Thank you for your fast track lanes and charming gift shop. Thank you for your film and television appearances and your prominence in Sleep Train and Lexus commercials. Thank you, old friend, for the reassurance that when I hear a bridge breaks, I know it’s not you.
Sure, you’ve been closed a few times. Like for really horrible car accidents or because Woody Harrelson wants to save a tree. But it’s never your fault. Nothing is.
You, Golden Gate Bridge, are my favorite bridge. And I love you.
Most sincerely,
Beth Spotswood
(via Eye on Blogs).
Old Moon Rising
Awesome:

Via The Planetary Society, via NASA’s LCROSS.
More Awesome:
via Japan’s Kaguya – more HD YouTube moon horizon low-angle shots here.
(Um, so why don’t we have a bunch of low earth orbit satellites beaming down shots like this of our lovely planet? I’d pay for a dedicated cable channel with an HD feed of that.)
And then we have the Earth and our Moon. And Jupiter and its moons. As seen from Mars.

via the Mars Global Surveyor, via JPL and NASA.
Please review your tax dollars at work – 50 years of space exploration.

Via Laughing Squid, via National Geographic.
SF Street Food Showdown
The Commonwealth Club is interviewing some of our favorite Street Food Personalities this Thursday the 29th. SFPs include:
- Anthony Myint, Mission Street Food
- Brian Kimball, Magic Curry Kart
- Steven Gdula, Gobba Gobba Hey
- Charles Phan, Executive Chef, Slanted Door
- Tamara Palmer, Contributor, Pavement Cuisine, SF Weekly – Moderator
(Is it wise to have that many street food people inside at once? Will they have their wrists bound and engage in a Beat It-style knife fight? If so, my money’s on Anthony. Oh man, Gdula’s so screwed. He will rue the day he focused on cream-filled treats rather than working in a full kitchen.)

Following the discussion, there will be a concentration of street food so massive, so profound, that SONGS WILL BE SUNG AND TALES WILL BE TOLD.
- Bacon Potato Chips
- Bike Basket Pies
- Creme Brulee Cart
- Gobba Gobba Hey*
- Magic Curry Kart
- Mission Street Food
- Soul Cocina
- Sweet Constructions
- Smitten Ice Cream
*This presumes all SFPs survive the knife fight.
Location: SF Club Office (program), 111 Minna (post-panel street food tasting)
Time: 6 p.m. check in, 6:30 p.m. panel, 7:30 street eats party at 111 Minna
Cost: $12 members, $20 non-members, $7 students (with valid ID)
Bernal Bernal Everywhere
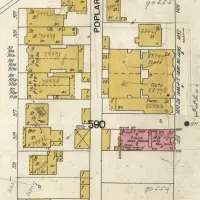
Updates to the El Rio Mission/Valencia history post — UC Berkeley has the 1857 map for the Bernal land claim settlement – the tract is enormous, click to see the entire thing. But here we zoom to “Widow Carmen Bernal’s House”. (J.C. Bernal died in 1842, and the family spent five years in US courts securing the land grant after California was admitted to the U.S.)

The Bernal house was on the north side of what would become Duncan, under what is now the SE corner of the St. Luke’s parkade. Here’s a snippet of the land grant map I loaded into Google Earth:

Click image to zoom, or see the entire map on Calisphere.
Note this matches up perfectly with the 1859 US Coast Survey map. (The red rectangle is El Rio.)

Plus they got this fine seal:


