The Mission – Bringing You Blight Since 1945
Scanner, history. History, scanner.
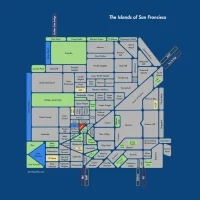
Here we have “The Master Plan of the City and County of San Francisco: Classification of Areas for Redevelopment (1945)” scanned by the indominable Eric Fischer.
While less colorful than our previous Blight Map of 1948, this is more detailed, revealing blight block by block. (Guess if the dark shading means good or bad.) Behold a 450 pixel-wide slice of blight from North Beach down to the Mission.

(Note this is even before 101 went in. And they certainly had their eyes on building on top of Bernal — those would have been epic streets.)
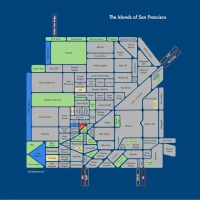
Here we have the key:

$40 adjusted for inflation is just under $500 today — I can only imagine how gobsmacked the city planners of 1945 would be to see Craigslist rental prices 3 to 6 times higher on their “substandard” properties.
It’s fascinating how blocks with million dollar homes were considered tear-downs 65 years ago.


The 1940s planners didn’t actually want to build those streets on top of Bernal Heights. They had been planned as part of the original subdivision of the area but never had anything built on them because they were impossibly steep, yet they had never been formally withdrawn from the street system either so were still shown with dotted lines. You can see a similar situation in the original Diamond Heights grid and in McLaren Park. The 1940s attitude to streets was more exemplified by Bernal Heights Boulevard, which added a level-contour street around the peak in the 1930s.
Thanks Eric. Yeah, I remember the overly optimistic, Bernal-crushing “California Avenue” plan on various older maps, including the 1920 and 1899 city maps you previously posted.
Pretty amazing how plans like these perpetuate, despite their WTF qualities. I imagine the landslide on Bernal in the 1936 was a wakeup call.
Speaking of million-dollar teardowns, you might also like this illustration from the report using Noe Valley as an example of how blight disfigures San Francisco.
The 1940’s planners have marked North Beach and Chinatown as ‘F’. The key says the median year built (of the substandard buildings and not the area) was before 1894; curious, considering the entire area was destroyed in 1906. Damn those time machines, blighting the freshly built neighborhoods that rose from Phoenix’s ashes!