Rescue Me From Blight (Seriously)
It’s 1947. You have neither TV nor blogs — how do you evangelize? Posters and pamphlets of course.
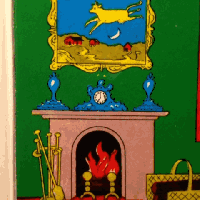
Eric Fisher brings us scans from the 1947 campaign to redevelop the Western Addition, aka “raze a neighborhood.”
One method is the strategic use of color. Simply layer green upon black. Problem solved!

Down with fire! And garbage! And bay windows! And cars running into giant oil barrels!

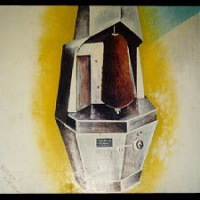
Imagine what these guys could have done with Photoshop
Note: I’m all for public health and children not living in squalor. But the shame of children wearing overalls and the high social cost of dressing like hipsters clearly justify massive urban renewal.

Mr. Stripey Jacket kind of looks like Morrissey, either with a hangover, or about to start a solo.
I did find this copy entertaining:
“Gone are the disreputable joints, the so-called smoke shops, the ‘hotels,’ and pool hall hangouts known to the police. Gone, too, are the alleys in which juvenile gangs plotted mischief that sometimes ended in murder.”
Damn you, 1940s — we could use a couple more pool halls in the Mission. That pool table at Latin American is rarely free of jackets or asses (not that I could get through a game with their margs.) But I digress.
“The rigid street system, with its death-trap intersections, is reorganized, simplified. The indiscriminate mixture of commercial, industrial and residential structures that is the disease of blighted areas is nowhere to be seen.”
Guess they were against mixed-use development. Given that’s a primary reason I live in SF (so I can walk places) I don’t think I would have enjoyed the New City. Sure looks pretty though:

"Honey, here blight was once rife."
While the 40s-era planners’ “build projects and highways” plans may have been flawed, were they onto something in terms of urban renewal, quality of life and safety? Did they see the fundamental changes in society and the jump in crime that would be brought by the 60s?
I found some ridiculously detailed homicide stats that name every person ever murdered in SF from 1849 to 2003 — the very first on the list was Beatty Belden, shot by “Chileans” on Telegraph Hill because of a “misunderstanding” — and crunched some numbers over time. (I took the 10 year census numbers and extrapolated SF population for other years , except for the last 10 years where I found yearly US census estimates.)
")
SF Homicide Rate, 1860-2008 (per 100K)
The 20s-40s were positively halcyon days in terms of murder in San Francisco — I’m kind of surprised that the rate was so low during the Great Depression and Prohibition.
But murder rates jumped drastically in the 60s. I’m neither a statistician nor a criminolisiticist, so sorry for any miscalculations, but homicide rates approached those of the 1870s.
This jump happened nationally, pointing to greater societal issues, but the SF rate was surprisingly high, even compared to NYC during the 70s. Granted cities like DC/Detroit/Baltimore were much higher, but let’s face it, the 60s-80s (suburban flight, racial discord) was a rough time for America.

SF-NY-Chi-US Homicide Rate, 1870-2007
US and FBI data, NY source data, Chicago data. Lots of extrapolating but the trends are clear.
SF leveled off in the 70s, and the 90s were a turning point for the rest of the nation. Chicago is well on its way down and NYC homicides have plummeted and now at the national average. SF was dropping as well but is now ticking up, WTF?
But I guess Gavin can rest comfortably knowing that none of this matched the epic murder rates of the Barbary Coast days of the 1850s (or New Orleans today).
")
SF Homicide Rate, 1849-2008 (per 100K)
For all those sociologists out the frantically pounding away in the comments section that I’m doing it wrong, you’re probably right. In fact, the FBI puts out a press release each year warning people not to do a straight comparison of homicide rates. Georgia State University publishes a homicide ranking list adjusting for socioeconomic factors (poverty, median income, male unemployment, race composition, and female-headed families). SF doesn’t come out so well.
| City | Adjusted Rank | Net Rank |
| Newark | 1 | 4 |
| Baltimore | 2 | 2 |
| St Louis | 3 | 3 |
| Oakland | 4 | 6 |
| Phoenix | 5 | 22 |
| San Francisco | 6 | 23 |
| Albuquerque | 7 | 38 |
| DC | 8 | 5 |
| Miami | 9 | 11 |
| Tulsa | 10 | 19 |
| LA | 21 | 32 |
| Chicago | 50 | 17 |
| New York | 60 | 47 |
Once again I find myself at the end of a post much longer than I intended to write, struggling to come to some sort of meaningful summary on top of snarky commentary and pretty pictures. (Damn you Eric Fisher!)
As for the idea of grassy fields and apartment buildings calming society, I doubt it would have made a difference in the 60s. Just look at the failure of most if not all American housing projects or the riots in the banlieues of Paris in 2005. You can build all the elevators you want but race and jobs are undeniable factors.
Despite the crime wave in the 70s, New York made such density via elevation work. But how many other any other cities have done so? Tokyo? Vancouver? Singapore? Not many. What makes the difference? Is it possible to build a society that matches density with safety, or are we at the mercy of national socioeconomic trends?


Great crime graphs!
This is a capt. obvious response to a thoughtful post, but the socialist architecture of the 40s and 50s was largely borne out of an impulse to organize and control human behavior (note how nearly every design, like the image you posted, has highly-cordoned-off ‘green, exercise’ areas- blegh), and the verdict of history has been that such attempts to control people through urban planning only make them go more ape-shit. Which actually sort of reassures me about human nature somewhat. So, maybe the reality is that while it’s possible to combine high density and safety, the more you TRY to do it harmoniously, the more disastrous the results. The calamity of Pruitt-Igoe is a fine case study, for one.
Of course, East Bloc countries had the totalitarian social controls to enforce the types of behaviors they wanted to invoke, so I don’t think the plentitude of box housing caused any rise in violence over here, but rather just made people yet more depressed.
“Chileno” was a generic term for non-Mexican Latinos during the Barbary Coast days, at least according to Herbert Asbury and Isabel Allende. Them and huge numbers of criminal deportees from Australia known as Sydney Ducks for a while put the murder rate at 2 per day in a population of a few tens of thousands — I think the violent mortality numbers before the 1851 vigilante movement must be among the highest ever anywhere in the world short of war. The figures for the 50’s in general are much lower than the likely real figures for 1849 – early 1851, it was unimaginably chaotic.
The density question doesn’t necessarily overlap completely with the high-rise question. The economics of wood-frame construction in California are so compelling that absent some bad planning decisions, over the last 3 decades we would have probably built a few hundred thousand more mostly 2-5 story wood-frame apartment buildings and row houses around the places where the crummy 60’s buildings now stand. There are these liminal places all over California, the places that have 60’s and 70’s apartment buildings right next to fairly compact, pre-suburban houses — places like 4th St between La Cienega and Fairfax in LA; Benvenue Ave from Dwight to Derby in Berkeley; the area west of the Hillsdale shopping center on the peninsula, to take a few examples. These places were filling in and urbanizing in a way that somehow became impossible in the 70’s and 80’s, it is like looking at urban suspended animation. San Francisco is not the worst offender in this regard — it didn’t stop the expansion of low- to mid- rise urbanism until the “Richmond special” battles of the 80’s, but now it is as bad as everywhere else. Residential towers are maybe nice but more fundamentally we just need to rediscover whatever it was that once let us replace smaller buildings with bigger ones. You can get plenty of density in 3-5 story apartment buildings, unfortunately you can’t currently build those anywhere in the Bay Area that makes sense — say within walking distance of West Portal or Bernal Heights or Los Gatos or the North Berkeley BART. I am aware how crazy that sounds and that it is taken for granted that we will literally burn our atmosphere before we offend the sensibility of NIMBYs, but the density question really begins and ends with them.
Jane Jacobs is laughing from the grave. It was this kind of misanthropic thinking that gave inspiration to her opus, The Death and Life of Great American Cities. Read it if you have not already!
Too bad we lost the Filmore to these people, thanks in no small measure to the Japanese internment.
Right on, KC, and they are doing it to SOMA as we speak. Of course, now since the emphasis is on non-profit “affordable,” and its the only Union construction for residential to be found, it’ll be another 30 years before people wake up and realize the nightmare is right down the street.
That list of murders in the city that Officer Mullens put together got me interested in the stories of what happened to all of those people. I ended up going to the history room at the library and looked at the coroner reports. I compiled a lot of those stories from 1955 and put them to a google map if you wanna check it out:
http://maps.google.com/maps/ms?ie=UTF8&hl=en&msa=0&msid=101289211293820073005.00044449857af71d75ef3&ll=37.763387,-122.438164&spn=0.14222,0.307274&z=12
I also mapped all of the murders from 1929 to 1955 if you want to check them out. It is interesting to see them laid out on the grid to see the trends that were taking place. The Western Edition was where a lot of those murders were taking place — most of which were around where the new St. Mary’s Cathedral is located.
Kevin Mullen had the most amazing research on crime in San Francisco
https://cjrc.osu.edu/research/interdisciplinary/hvd/united-states/san-francisco
Shows a detailed description of all (or nearly all) the murders from 1849-2003!
San Francisco was at its worst in 70s, particularly 1977 with the Golden Dragon Massacre, war between Wah Ching & Joe Boys. The 80s and up to mid 90s, particularly 1993, was bad, and it was bad from 2006-08 before a drop off in 2009.
Transplants to SF don’t realize how relatively bad SF used to be compared to now. That’s not saying it’s safe or bad things can’t happen, but SF is more on level with the national average in murder rate, and used to be 2-3 times higher.
I was looking at the late 70s, and besides Chinatown, I figured most murders would be in Fillmore and HP. There was there share there, but I was surprised at how many were in the Tenderloin. The TL has always been bad, but I didn’t expect it to be THAT bad when I looked at the murders. One year had almost 20 murders in the TL.
Unsurprisingly, there were a lot of killings in public housing, especially the old Army Street projects, OC projects on Turk/Eddy and Laguna/Buchanan, and the Hayes Valley (Death Valley) projects on Fell/Hayes and Buchanan/Webster, with the same type of projects also on Page/Haight and Buchanan/Webster.
Very cool map. I love some of the stories… musta been a lot of work to put this together.
Damn, Marc, that is amazing work. I want to turn that into a heat map and frames of a movie.
Or we add it to the Stamen crimespotting map. Historicriminography!