Rent from on High
Stephanie May, aka @mizmay, has generated a rather amazing zoomable heatmap of 1 BR rental prices in San Francisco.

I love (and agree with) her assessment that her map is”better than all the others that came out in the past two weeks”:
1. I used a dataset that spans a longer time range than one month, so that the sample sizes per neighborhood are larger. My data spans the second half of 2012.
2. I filtered for duplicates, so that the same apartment listed multiple times does not skew the data.
3. I used median instead of mean, which makes sense when you are dealing with a lot of outliers. You should be suspicious every time you see some shocking statistic about the “average rent” in San Francisco. The high end skews things quite a bit.
4. The fact that I am even explaining my methods and assumptions.
5. Instead of a silly choropleth, I made a super-pretty heat map based on the spatial variability of listing prices. The interpolation is based on ordinary kriging, and I underlay it with contours to bring out the variation a bit more.
Bolding by editor. Using median instead of mean makes for a much better map.
And even better, she created “violin plots” to show the rent distribution within each neighborhood.
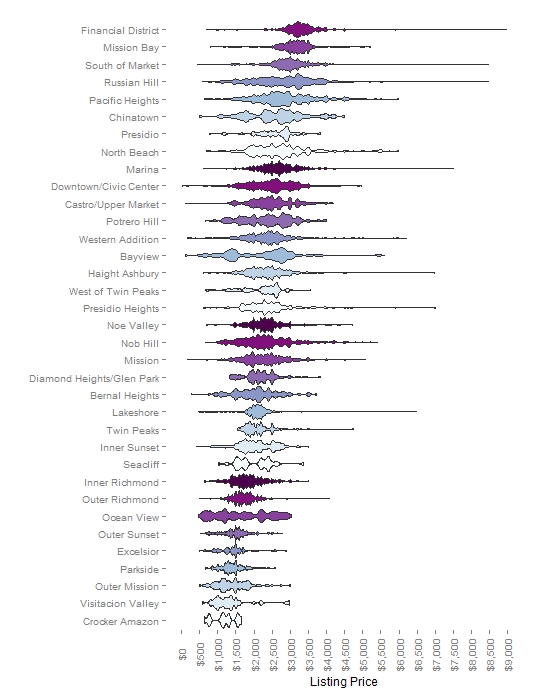
Here are the number of units per neighborhood (remember, this is across the second half of 2012):

The Mission and Bernal are still considerably cheaper than the foggy northlands. Here’s a zoom and enhance of some SESF neighbourhoods:

(Thanks, Stephanie for the better resolution images.)
I was initially surprised by the bimodal Bayview, but Stephanie points out that is due to new construction near Candlestick and Mission Bay.
A version of this for houses (per sq ft I guess?) would be interesting, as would playing (sorry) the violin plots over time. Anyway, hooray, Stephanie and TileMill and MapBox!


I’m surprised by how high the rents on Potrero Hill have gotten!
Yeah — pretty close to downtown though. Playing back the data through the past few years would be very interesting.
MUCH better than that horrendously misleading housing price map that made the rounds a couple of weeks ago.
Still though she retains one of the core problems that one suffered from: Why doesn’t she cite her data source? That’s fishy…
Agreed on that last housing price map — I intentionally didn’t post on that one.
Did you click through to her Tumblr? “The data was kindly donated by PadMapper.com.”
If it is from padmapper then it is a little bit self-selected. Last I looked, they only have stuff from craigslist where the advertiser enters an address or intersection. A surprising number of ads don’t have this. If you are using padmapper instead of craigslist directly then you are missing a lot of stuff.
You can’t make a map without that info though, so the alternative is that you can only break things down by neighborhood. And the neighborhood is chosen by whoever posted the ad, which tends to be optimistically inaccurate in some places.
Very nice work.
This is an interesting map. However, please note that where there are no data (e.g., a block without any 1br apts listed in 2012) between two high-rent-spots, the contouring algorithm infers a low value in order to keep the contours smooth. This creates local variability in the contours where no variability in rents may actually exist.