Ghost in the Shell
More data made into maps:
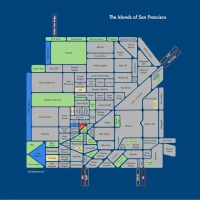
Rhonda Friberg kindly points out Tim Sinnot‘s SF adaptation of Andy Woodruff’s paint-by-numbers idea — “displaying all addresses in a city by number, color ramped”:

The canals are very obvious. And as Tim notes, the gaps speak volumes.
Market, Mission and 3rd are probably the best examples of linear address scaling. Everything else is a crapshoot by neighborhood.
(Reading the Swordpress and Cartogrammer I realize what an utter map hack I am — apparently you can use computers to AUTOMATICALLY make maps. Astonishing.)
Speaking of others with mastery of both zeros and ones, Eric Fischer has computed yet another map out of SF Muni data. This one is a month’s worth of data:
Average speed at each location according to NextBus, April 13 – May 21, 2010.
Black is stopped (less than 3 mph). Red is slow (3-5 mph). Blue is normal operating speed (5-9 mph). Yellow is fast service (9-19 mph). Green is rapid movement (faster than 19 mph).

The Mission:

(Hint: take the 12 or the 27 instead of the 14.)
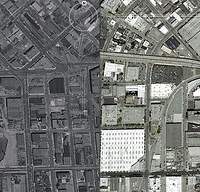
Here’s the same data in greyscale:
Average speed at each location according to NextBus, April 13 – May 21, 2010.
Each level of gray represents a speed increment of 0.1 mph, up to a threshold of 24 mph.

Downtown to 280/101.

It looks like a charcoal sketch by Da Vinci or Michaelangelo.


It looks like if you gave Seurat and Velazquez a .1 mm mechanical pencil and asked them to draw a map of San Francisco while seated in the back of the car of some kids looking for a rave in 1996 (it took them 15 hours to find, bc it was on treasure island). IE, more awesome from Eric Fischer.
Eric — is there any hope we might get a dump of some of this data? I mean, I can kind of get my head around making a series of queries to flickr and picasa, but this is some next-level stuff. Did you set up some sort of daemon to check in with NextBus every so many minutes and leave it running for a month? Can we have an api where somebody brings you a couple of flash pen drives and leaves with a massive smile and the promise of weeks of uninterrupted reading of the matplotlib docs?
Yes, that is basically what I did — the Muni web site claims it is OK to ask about the vehicle locations as often as every 15 seconds, so I started a cron script running that would ask every 30 seconds and accumulate the results.
It’s silly for everybody who wants this to have to individually query Muni every 30 seconds, so I’ll be happy to upload a copy of the data somewhere, but it is kind of big — about 90MB per day. Do you have somewhere good to host it?
Yes I can figure out hosting. I will send you a flickrmail and donate bandwidth for whoever wants to download whatever you are able to share.
Excellent, thanks!
Check your flickrmail and to any and all the site for data will be sfgeo.dyndns.org/data ; it is up with just a test .png at the moment derived from TIGERLINE.
Thanks to Concerned Guajolote’s web hosting, the vectors for the Muni map are now available for download at http://sfgeo.dyndns.org/data/muni/ and the ones for the Geotaggers’ World Atlas at http://sfgeo.dyndns.org/data/atlas/
Eric and everybody,
The data is awesome, you can futz around with it at the above links. It is a real pleasure to have so many vectors fresh out of the oven.
Eric sent an explanation of the records in the .geo files, which is linked on the front page.
I also put up some PostGIS dumps of the #1 and #4 Atlas projects at http://sfgeo.dyndns.org/data/contrib and some sample pictures I rendered from them. It is really rare to have such a fun data set. Also there is a little hopefully self-explanatory python script to generate WKT formatted SQL (should also work with mysql). I will try to get things working such that there is an easy way to export KML from these datasets.
If anybody knows how to use spatialite and could contribute flat files for use with QGIS, especially of the SF data, that would be great to have.
I keep going through Fischer’s stuff and I just keep not believing how awesome it is.
There are several hundred historical maps overlaid precisely and transparently onto google earth in a way that sort of turns the walkingsf photo stream into a photo firehose. Those are now rolled into an archive that is small (the images are pulled from flickr and rotated and aligned by google earth). You can download the whole thing here:
http://sfgeo.dyndns.org/data/sfbay-historic-kml.zip