Damn, Tourists!
Eric “The Incredimazing” Fischer used advanced geo-logic to filter tourists from locals in his Geotagger’s World Atlas.

Some people interpreted the Geotaggers’ World Atlas maps to be maps of tourism. This set is an attempt to figure out if that is really true. Some cities (for example Las Vegas and Venice) do seem to be photographed almost entirely by tourists. Others seem to have many pictures taken in places that tourists don’t visit.
Blue points on the map are pictures taken by locals (people who have taken pictures in this city dated over a range of a month or more).
Red points are pictures taken by tourists (people who seem to be a local of a different city and who took pictures in this city for less than a month).
Yellow points are pictures where it can’t be determined whether or not the photographer was a tourist (because they haven’t taken pictures anywhere for over a month). They are probably tourists but might just not post many pictures at all.
The maps are ordered by the number of pictures taken by locals.
Full set on Flickr, a few interesting ones below (click image to zoom)
NYC:

London:

Vancouver:

LA:

Rome:

Vegas:

Venice:

Detail of San Francisco:

Tourists are rare in the Mission, but they do seem to prefer the Castro, the southwest corner of Dolores Park and the murals on Balmy Alley.

Trackbacks
- Damn Tourists | friskyGeek
- Where the tourists really flock
- links for 2010-06-09 « Onlinejournalismtest's Blog
- Linkage: Bay Bridge Ferris Wheel Edition « STRUCTURE
- Kam chodia v Prahe turisti a kam len domáci? Prezradí to mapa intenzity fotografovania. | Médiář.cz
- Four Great Infographics No. 8 – 风调雨顺|信息美图
- Do Tourists Frighten You? We Can Help.
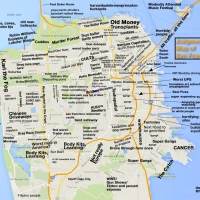


Tourists have one thing right — the top corner of Dolores Park is a great place to get photos of the city skyline. I didn’t know tourists were on to that spot.
You also get some fantastic views of gay beach!
Again though, this only really measures people who walk around taking pictures all the time and obsessively updating their flickr accounts.
I put up a little html5 canvas animation of the San Francisco data, you can see it here:
http://sfgeo.dyndns.org/data/contrib/efishpjs/
Speeds are like Eric’s original idea, blue – green – red in ascending velocity.
There is something so ingenious and deep about Eric’s data analysis — every single person who sees it, including for example Nathan Yau at flowingdata.com — everyone thinks, “yes but how did you know….”, and then you realize how much you can get from a relatively spartan data set. It is really enlightening.
Also, the man himself very generously made all the data available at:
http://sfgeo.dyndns.org/data
, if you missed my last 30 or so hyperventilating comments.
Holy crap. HTML has come a long way since ≤blink≥.
Any chance you can add a running timestamp and a slider to that?
I am pretty sure I saw a photowalk in the Mission about halfway through.
Check it out again if the first one had too much line noise, I just updated it, fewer long vectors, which don’t map to streets so well.
I will try to add those things, should be able to get a pause at least. html 2010 = VHS 1981. There are definitely a few photowalks in the mission. There is also a fairly amusing one in Secaucus (atlas 1).
Hey CG, can you put your email in the “unpublished email” field in a comment so I can get in touch with you re the animation?
Contact should be updated
Basically it is using processing.js, which is extremely simple and nice to work with.
Great animation! Thanks for making it. What is the time scale?
I had a hard time figuring out what to do with things like the Secaucus photowalk, and also with a few people in Mountain View and Taipei who have automated cameras set up posting a new picture of the same thing every few minutes. I ended up excluding them from the cluster calculation (because otherwise they give way too much weight to those locations) but leaving them on the map.
The period covers the span of everything you uploaded, but a lot of things are left out. One version had all trips within a 10 minute parameter which I think was your original boundary but it looked too busy on a 800 x 800 pixel canvas. I want to do one with a different color for every user to trace movement etc., and add user controls. There are so many options — actually one of my big interests is seeing how infrastructure and the built environment affect movement and settlement patterns — so I want to filter out the tourist element and hadn’t thought how I might do that until this photo set ;)
Do you have one of DC? It would be great to figure out professional shoots (ads, business) vs. tourists in NY, LA, SF, DC, etc.
Yes, the DC map is http://www.flickr.com/photos/walkingsf/4672195208/
If you’re trying to find professional shoots, keep in mind that this is not all photos taken in the city, only those few that are posted to Flickr or Picasa with geotags!
Eric.. thanks for the FAST and fascinating response. Good work all around! Yes, awesome!
Holy crap, all you guys are awesome.
My favorite reference yet — geolocalizzazione!
Translation here.
Concerned Guajolote, they sadly did not translate your username. (Nor mine.) “Burrito Giustizia! Preoccupato Guajolote!”
But Eric, you get one: “Eric (l’incredistupendo) Fischer“!
Translation here.
I think I will sign emails for a while with: “Potete addirittura vedere un’animazione realizzata da Concerned Guajolote che disegna una mappa con i vari mezzi di trasporto.”
The logs for the traffic you are generating are incredible btw; like %5 IE, actually you have sent over more ipad users than Explorer users. San Francisco values!
“Incredistupendo” also hit the WSJ — and here I am trying to make a mission hyperlocal visualization where the paths of the photographers are drawn arbitrarily by fixie, lowrider, and stroller icons. For the real stuff it is just faster to wait for Eric.
Heh: http://blogs.wsj.com/metropolis/2010/06/08/tourists-and-locals-photograph-different-new-yorks/
I’m getting crazy hits, but wordpress.com stats are meh, so hard to see where they’re from.
I’m having a hard time tracking where links are coming from too because so many of them are to the set instead of to individual pictures, and Flickr stats don’t track referrers for sets. But there sure seem to be a lot of them.
You just made Gawker and Gizmodo.
You’ve been in my feed reader about 10 times so far, several times as a “cool” recommendation, usually with dozens of “likes”.
And here comes Boing Boing:
http://m.boingboing.net/2010/06/10/locals-and-tourists.html
It will be difficult to do it for our island on Sundays and during rain and hurricane season, when tourists dissappear :)))
hm, understand:)
does anyone know if there is a version of this maps in a world map version?
The world map is http://www.flickr.com/photos/walkingsf/4798039291/in/set-72157624480426050/ but it’s really hard to discern anything interesting at that scale.
thank you eric. you are right. most details are gone at that scale. wonderful work!
Yellow points are pictures where it can’t be determined whether or not the photographer was a tourist (because they haven’t taken pictures anywhere for over a month). They are probably tourists but might just not post many pictures at website design.
Yellow points are pictures where it can’t be determined whether or not the photographer was a tourist (because they haven’t taken pictures anywhere for over a month). They are probably tourists but might just not post many pictures at all. accounting software
Hi thanks for posting thiis